Introduction
At youcubed we are so excited to share this activity derived from a problem in Core-Plus Mathematics, Course 1. The problem included here is from Unit 3, Linear Functions, where students explore a small sample data set from the World Health Organization, Global Health Observatory Data Repository, faostat3.fao.org. We love the use of real data as students work, in this case, with linear functions and data.
Data talk
Share the table of Health and Nutrition data, on page 4 of the handout, as a data talk. This is a great way to formatively assess where students may be with data as well as provide an opportunity to discuss the meaning of the data. Students should recognize that this is a small sample of a larger data set that can be found on the site listed below the data table. You may find topics or vocabulary that are important for understanding the context. This activity provides an opportunity to see where students are with interpreting data from a table, understanding that two-variable data can be represented as ordered pairs and plotted on a coordinate plane, and two data points can be used to determine the slope and equation of a line that fits the pattern in the data.
Investigation
Share the Core-Plus Mathematics on page 4 of the handout. Ask students to read the questions and discuss ways to complete the data study together, making sure all ideas are heard and valued. Have students work collaboratively through the problem before you discuss any methods or ways to solve it. This provides a time for students to engage together as data explorers and for you, a co-explorer to see where students make wonderful discoveries and encounter struggle. Remind students to embrace struggle and mistakes and engage with a growth mindset. For growth mindset resources and videos go to our WIM page at, https://www.youcubed.org/week-inspirational-math/ and select videos for your students.
We recommend students use CODAP (https://codap.concord.org/), although other technology tools can be used. Inside CODAP, https://codap.concord.org/app/static/dg/en/cert/index.html, students enter the data and generate graphs of the results . In the tools section of CODAP students can use a line to model the data. Here is a sample site where the data has been entered into CODAP, https://tinyurl.com/229v8rda. CODAP has many tutorials and is user friendly.
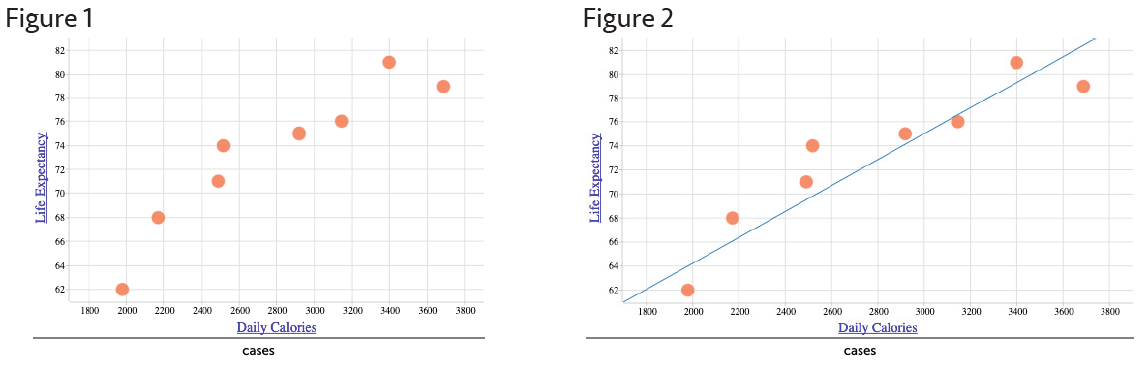
We recommend that you let students discover and share how they enter data, create a plot and fit a line. Figure 1 is an image of the scatterplot for Daily Calories and Life Expectancy generated in CODAP. Figure 2 shows the “movable line” tool positioned as a linear model.
Discussion
As groups of students are working on this problem pause and ask students to share where they are. These discussion points are not meant for answer sharing, they are meant for students to share ideas, questions and other findings they think are important. This is a way to reinforce the idea that the class is in this together, as data and technology explorers. The final discussion can be centered on group responses to the various problem parts and explanations of use of their linear models. One valuable discussion point is determining what a “good fit” might be. Some students may have discovered the “Least Squares” line in the tool section of CODAP. A conversation around this idea and how it compares to other methods for fitting lines to data can lead students into further exploration and study.
Reflection
To summarize, ask students to reflect on this problem-solving activity by asking, “What did you learn from work on this problem? What questions do you have? How can you use algebra as a tool in helping to answer questions involving analysis of two-variable data?
